If you’re importing from China, ocean freight is your bread and butter. But here’s the thing — the difference between a profitable shipment and a money pit often comes down to decisions made before your cargo hits the dock. Let’s cut through the noise.
FCL vs. LCL: It’s Not Just About Volume
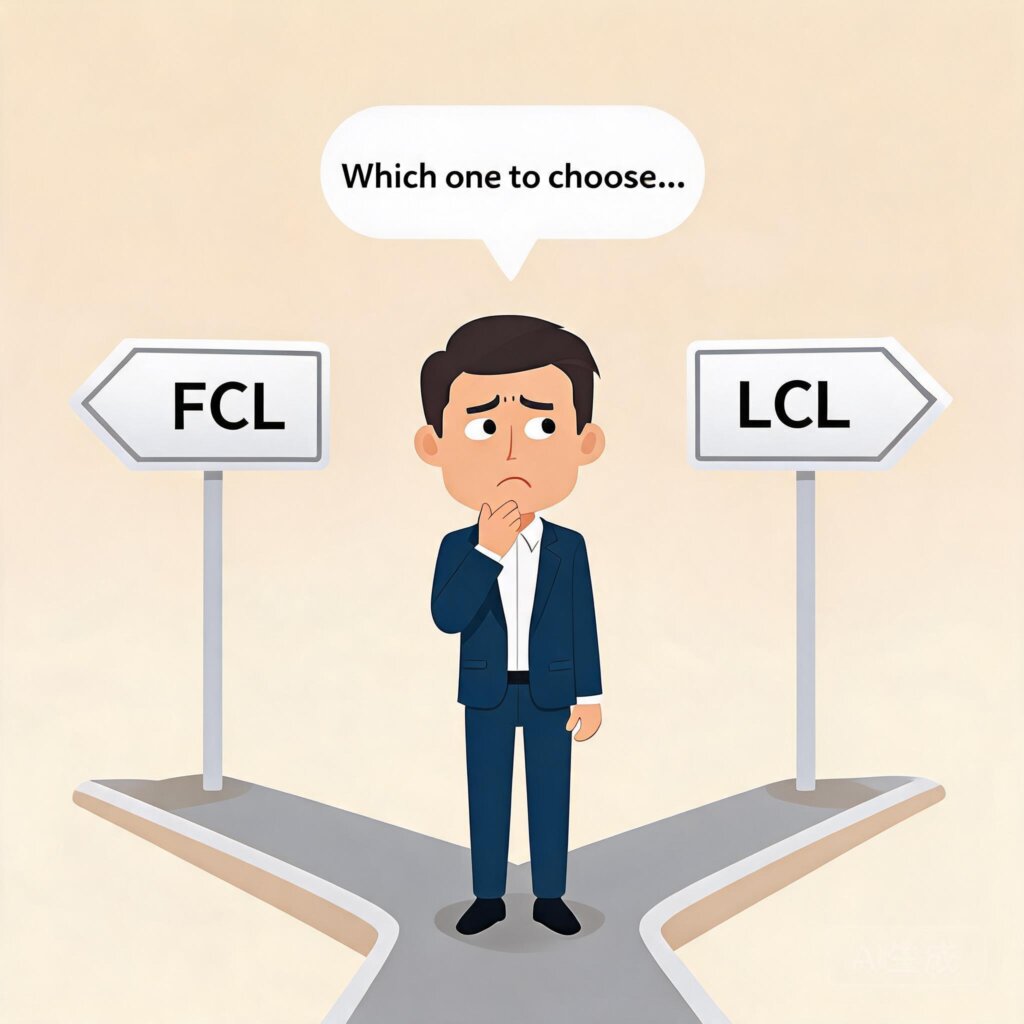
The FCL vs. LCL decision looks simple on paper — full container vs. shared space. In practice, it’s trickier.
FCL (Full Container Load) isn’t always the right call above a certain cubic meter threshold. Here’s what the rate sheets don’t tell you:
• Break-even point: For general cargo, the cross-over is around 18–22 CBM on a 20GP (28 CBM usable) and 38–45 CBM on a 40HQ (68 CBM usable). Below that, LCL can win — but only if the consolidation warehouse isn’t gouging you on handling fees.
• The hidden FCL trap: If your cargo only fills 15 CBM but you book a 20GP, you’re paying for 28 CBM worth of space. That’s ~ 800–1,200 in wasted freight on a China-US West Coast route. Sometimes LCL at 15 CBM comes out cheaper even though the per-CBM rate is higher.
• When LCL hurts: LCL shipments sit at origin CFS (Container Freight Station) waiting for co-loading. You lose 3–7 days on average. If you’re chasing a shelf date or a seasonal window, FCL’s direct vessel loading is worth the premium.
Practical rule: For cargo under 12 CBM, always quote LCL. For 12–22 CBM, quote both. For 22+ CBM, FCL is almost always the winner.
Key Port Pairs on the Two Busiest Trade Lanes
China → US (Trans-Pacific):

Pro tip: LA/LB still handles ~40% of all US container imports. If your final destination is Chicago or Dallas, LA/LB + rail (IPI/MLB) often beats an all-water route through the Panama Canal to an east coast port — saves 7–10 days.
China → Europe:

Watch out: Hamburg and Rotterdam are chronically congested during peak season (Aug–Oct). Felixstowe has labor disruption risk. Always build in 3–5 days buffer on these routes.
LCL Consolidation: Where the Pros Save
1. Cube not weight: Most LCL freight is charged on the larger of actual weight (per 1,000 kg = 1 ton) or volumetric weight (1 CBM = 1 ton). If your cargo is light but bulky, negotiate a freight-all-kinds (FAK) rate with a lower minimum.
2. Direct vs. hub consolidation: Direct LCL means your cargo loads directly at origin port without a transshipment hub. Hub consolidation (Hong Kong, Busan, Singapore) adds 3–5 days but offers more frequent sailings and lower per-CBM rates.
3. Tailgate loading: Ask your forwarder to load your LCL shipment last so it’s the first off at destination. This cuts deconsolidation wait time by 1–2 days.
Ocean Surcharges: The Line Items That Eat Your Margin
Standard ocean freight rates are just the starting point. Here are the surcharges that routinely add 20–40% to your total:
• BAF (Bunker Adjustment Factor): Tied to fuel prices. Current range: 200–600 per container on Trans-Pacific. Ask for a fixed BAF in your contract.
• GRI (General Rate Increase): Carriers announce GRIs on the 1st and 15th of each month. Book before GRI announcements.
• PSS (Peak Season Surcharge): Hits June–November. Typically 500–1,500/container.
• D&D (Detention & Demurrage): The silent killer. Free time is usually 7 days at origin, 5–7 at destination. Overstay by one day and you’re looking at 100–300/day/container.
• ISPS, AMS, ENS (Security filings): Small per-BL fees ( 25–50) but don’t skip them — a missing AMS filing means cargo doesn’t load.
Bottom Line
Ocean freight is a commodity service, but the way you buy it isn’t. The difference between a good rate and a good landed cost is in the details — consolidation strategy, port selection, surcharge awareness, and buffer planning. Next time you’re booking a shipment, run the numbers on FCL vs. LCL for your specific CBM, check the surcharge calendar, and ask your forwarder for direct LCL options before defaulting to the hub.
Next week: We’ll break down air freight — volumetric weight, airport selection, and when to fly vs. sail.